Automating GCP quota monitoring across multiple projects
Every GCP resource and API have quotas. In a big organization, you can start having production incidents due to hitting quotas you didn't know about in projects you have never touched before.
The incidents
In May 2026, a VPC dynamic route quota was silently exceeded. GCP dropped BGP-learned (Border Gateway Protocol) routes without any alert. Traffic to on-prem destinations fell back to the default internet gateway and was black-holed (dropped without notification).
A couple production services were down before the issue was
traced to routeStatus: DROPPED in the Cloud Router output.
The fix was a quota increase and a BGP re-sync, but finding the root cause took a long time because nothing indicated that a quota had been hit.
A separate incident involved GKE Persistent Disk storage: usage grew from 900 GB to the 1000 GB limit during a GKE version update without anyone noticing until provisioning workloads started failing.
Both incidents had the same root cause: zero visibility into GCP quotas across GCP projects.
Why native solutions fall short
GCP does have quota monitoring built into GCP Cloud Monitoring. Here's the best doc on monitoring ⧉. You can create alert policies across projects that fire when a quota approaches its limit. So why wasn't it being used?
The problem is that GCP has two completely separate quota metric systems, and neither supports a simple "alert on everything" approach.
Consumer quotas
The first system uses serviceruntime.googleapis.com/quota/*
metrics with a generic consumer_quota resource type. These
cover API-level quotas: request rates, allocation limits,
storage quotas, and similar. A single quota_metric label
identifies which specific quota the time series belongs to.
The good news: you can write a PromQL ⧉ (Prometheus Query Language) query that matches all consumer quotas without specifying individual services or quota names. PromQL is a language for selecting and aggregating time series metrics. GCP Cloud Monitoring supports it as an alternative to its native query language, and it's what powers the alert conditions described below.
Resource-specific quotas
The second system uses service-specific metrics like
compute.googleapis.com/quota/dynamic_routes_per_region_per_peering_group/usage.
Each service defines its own monitored resource type and label
set. These cover infrastructure-level quotas: VPC routes,
instances per network, GKE nodes per cluster.
These aren't covered by consumer quota queries. Each metric
has its own path and its own set of labels for the on()
clause in PromQL. There are currently over 370 such metrics
across 28 services.
The VPC routing incident? That was a resource-specific quota. The native consumer quota alerts would never have caught it.
The solution
The requirements:
- Covers both quota systems
- Automatically picks up new quotas and services
- Works across all 300 monitored projects from a single place
- Doesn't require manual configuration per quota
Architecture
graph LR
    subgraph "Scoping Project"
        MS[Metrics Scope] --> AP[Alert Policies]
        AP --> NC[Slack Channel]
    end

    subgraph "Monitored Projects"
        P1[project-1] --> MS
        P2[project-2] --> MS
        P3[project-N] --> MS
    end

    subgraph "Auto-Discovery via github repo for managing Scoping Project"
        TF[Terraform] -->|data external| SH[get_quota_metrics.sh]
        SH -->|Cloud Monitoring API| PY[build_quota_promql.py]
        PY -->|per-service PromQL| TF
    end

    TF --> AP
All alerts run in a single scoping project. Every monitored
project gets added to its
metrics scope ⧉,
so one set of alert policies covers every project. PromQL
queries group by project_id, quota_metric, location, and
service, so each unique combination fires as a separate
incident. You know exactly which quota in which project and
region is at risk.
Consumer quota alerts
For consumer quotas, there are three alert policies. No service filter, no quota name filter. They match all consumer quotas automatically.
Allocation usage > 80%: resource limits like disk, CPU, IP addresses:
(
  max by (project_id, quota_metric, location, service) (
    last_over_time(
      serviceruntime_googleapis_com:quota_allocation_usage{
        monitored_resource="consumer_quota"
      }[6h]
    )
  )
  /
  min by (project_id, quota_metric, location, service) (
    last_over_time(
      serviceruntime_googleapis_com:quota_limit{
        monitored_resource="consumer_quota"
      }[6h]
    )
  )
) > 0.8
Rate usage > 80%: API request rates, with read-only APIs excluded to reduce noise. Hitting a read rate limit causes retries, not outages:
(
  sum by (project_id, quota_metric, location, service) (
    increase(
      serviceruntime_googleapis_com:quota_rate_net_usage{
        monitored_resource="consumer_quota",
        quota_metric!~".*/get_.*|.*/list_.*|.*read_requests.*|.*/read$|.*/fetch_.*|.*search_requests.*"
      }[1m]
    )
  )
  /
  max by (project_id, quota_metric, location, service) (
    last_over_time(
      serviceruntime_googleapis_com:quota_limit{
        monitored_resource="consumer_quota",
        quota_metric!~".*/get_.*|.*/list_.*|.*read_requests.*|.*/read$|.*/fetch_.*|.*search_requests.*"
      }[6h]
    )
  )
) > 0.8
Quota exceeded: safety net for anything that slips past the 80% warning, with the same read-only exclusion:
max by (project_id, quota_metric, location, service) (
  last_over_time(
    serviceruntime_googleapis_com:quota_exceeded{
      monitored_resource="consumer_quota",
      quota_metric!~".*/get_.*|.*/list_.*|.*read_requests.*|.*/read$|.*/fetch_.*|.*search_requests.*"
    }[6h]
  )
) > 0
When someone enables a new GCP API or Google adds a new quota, these queries pick it up with zero configuration changes.
Resource-specific quota alerts
Resource-specific quotas can't be covered by a single query.
Each metric has different labels. A VPC network quota has
network_id, a GKE quota has cluster_name, an AI Platform
quota has base_model. The PromQL on() clause must match per
metric.
Instead of maintaining a static list, a discovery script runs
as a Terraform
data "external" ⧉
source. Here's how it works in detail.
Step 1: fetch metric descriptors
A bash wrapper calls the GCP Cloud Monitoring API to get every metric descriptor in the scoping project. This includes metrics from all projects in the metrics scope:
curl -s -H "Authorization: Bearer ${TOKEN}" \
  "${BASE_URL}/metricDescriptors" > "${METRICS_FILE}"
curl -s -H "Authorization: Bearer ${TOKEN}" \
  "${BASE_URL}/monitoredResourceDescriptors" \
  > "${RESOURCES_FILE}"
The metric descriptors tell you what quota metrics exist (for
example,
compute.googleapis.com/quota/dynamic_routes_per_region_per_peering_group/usage)
and what metric labels each one has (for example,
limit_name).
The resource descriptors tell you what resource labels each
monitored resource type has. For example,
compute.googleapis.com/VpcNetwork has resource_container,
location, and network_id.
Step 2: filter to resource-specific quota metrics
A Python script processes the JSON. It finds all metrics
matching the pattern
<service>.googleapis.com/quota/<name>/usage and */limit,
excluding serviceruntime (those are consumer quotas handled
separately) and *_internal metrics (they have descriptors but
get rejected by the alerting API):
Step 3: resolve the correct on() labels
This is the tricky part. For the PromQL division
usage / limit to work, the on() clause must list every
label shared between the two sides. These labels come from two
sources: the resource type and the metric itself.
One gotcha: the resource descriptor calls the project label
resource_container, but in actual PromQL queries it appears
as project_id. This was discovered by querying the raw time
series API and comparing:
For quotas where usage has extra labels that limit doesn't
(mainly AI Platform metrics with a method label),
group_left() allows the many-to-one join.
Step 4: convert metric names and generate PromQL
GCP Cloud Monitoring PromQL ⧉ uses a different
naming convention than the API. The first / becomes :, and
all other special characters become _:
Each quota becomes one PromQL clause:
clause = (
    f"last_over_time({usage_name}[{lookback}])"
    f" / on({on_labels}) group_left() "
    f"last_over_time({limit_name}[{lookback}])"
    f" > {threshold}"
)
Step 5: group by service
Clauses are grouped by service name extracted from the metric
path and joined with or. The script outputs a flat JSON
object with keys as service names, and values as complete
PromQL queries:
{
  "compute": "last_over_time(...) / on(...) ... > 0.8\nor\nlast_over_time(...) ...",
  "container": "...",
  "storage": "..."
}
Terraform's for_each iterates over this map, creating one
alert policy per service. Currently that's 28 services covering
370+ quota metrics. When Google adds a new service with
resource-specific quotas, the next terraform apply creates a
new alert policy automatically.
A generated query for compute quotas looks like this (one
clause per quota, joined with or):
last_over_time(compute_googleapis_com:quota_dynamic_routes_per_region_per_peering_group_usage[6h])
  / on(limit_name, location, network_id, project_id) group_left()
  last_over_time(compute_googleapis_com:quota_dynamic_routes_per_region_per_peering_group_limit[6h])
  > 0.8
or
last_over_time(compute_googleapis_com:quota_instances_per_vpc_network_usage[6h])
  / on(limit_name, location, network_id, project_id) group_left()
  last_over_time(compute_googleapis_com:quota_instances_per_vpc_network_limit[6h])
  > 0.8
When a new service adds resource-specific quota metrics, the
next terraform apply creates a new alert policy for that
service automatically.
The Terraform
The Terraform configuration ties it all together. The
for_each ⧉
over the discovery script output creates one alert policy per
service:
data "external" "quota_metrics" {
  program = [
    "bash",
    "${path.module}/scripts/get_quota_metrics.sh",
    local.quota_monitoring_project_id,
    tostring(local.quota_alert_threshold),
    local.quota_alert_lookback,
  ]
  query = {
    exclusions = jsonencode(local.quota_alert_exclusions)
  }
}

resource "google_monitoring_alert_policy" "quota_resource_specific" {
  for_each = data.external.quota_metrics.result

  project      = local.quota_monitoring_project_id
  display_name = "Quota > 80% - ${each.key} resource quotas"

  conditions {
    display_name = "${each.key} resource quota > 80%"
    condition_prometheus_query_language {
      query               = each.value
      duration            = "0s"
      evaluation_interval = "30s"
    }
  }

  notification_channels = local.quota_alert_notification_channels
}
Technical challenges
Sparse sampling and alert flapping
Quota metrics are sampled infrequently. Data points arrive every 5 to 15 minutes with gaps. Alerts would fire when a data point showed usage exceeding 80%, then immediately resolve when the next evaluation found no data, then fire again when the next data point arrived.
PromQL alert conditions don't support
evaluation_missing_data = "EVALUATION_MISSING_DATA_ACTIVE"
(that's only available for condition_threshold). The fix was
wrapping every metric selector in last_over_time(...[6h]),
which returns the most recent data point within the look-back
window. No more flapping.
The resource_container gotcha
The GCP Cloud Monitoring API's resource descriptors list a
label called resource_container, but in actual PromQL
queries, that label appears as project_id. This was
discovered by querying the raw time series API and comparing
label names. The script maps resource_container to
project_id automatically.
Label mismatches between usage and limit
For some quotas (mainly AI Platform), the /usage metric has
an extra method label that the /limit metric doesn't have.
A naive division fails because PromQL can't match series with
different label sets. Using group_left() handles the
many-to-one join.
Read-only API quota noise
Rate quota alerts were extremely noisy. Quotas like
read_requests, list_requests, and search_requests would
fire constantly. Hitting a read rate limit causes retries, not
outages. It's low-risk noise that drowns out real issues.
A regular expression filter on the quota_metric label
excludes read-only patterns:
quota_metric!~".*/get_.*|.*/list_.*|.*read_requests.*|.*/read$|.*/fetch_.*|.*search_requests.*"
The workflow: alert to resolution
When a quota alert fires, here's the investigation path:
1. Alert arrives in Slack with the project ID, quota name, service, and current ratio.
2. Check the Quotas page in the GCP Console for the affected project. The Quotas & System Limits ⧉ page shows current usage alongside limits.
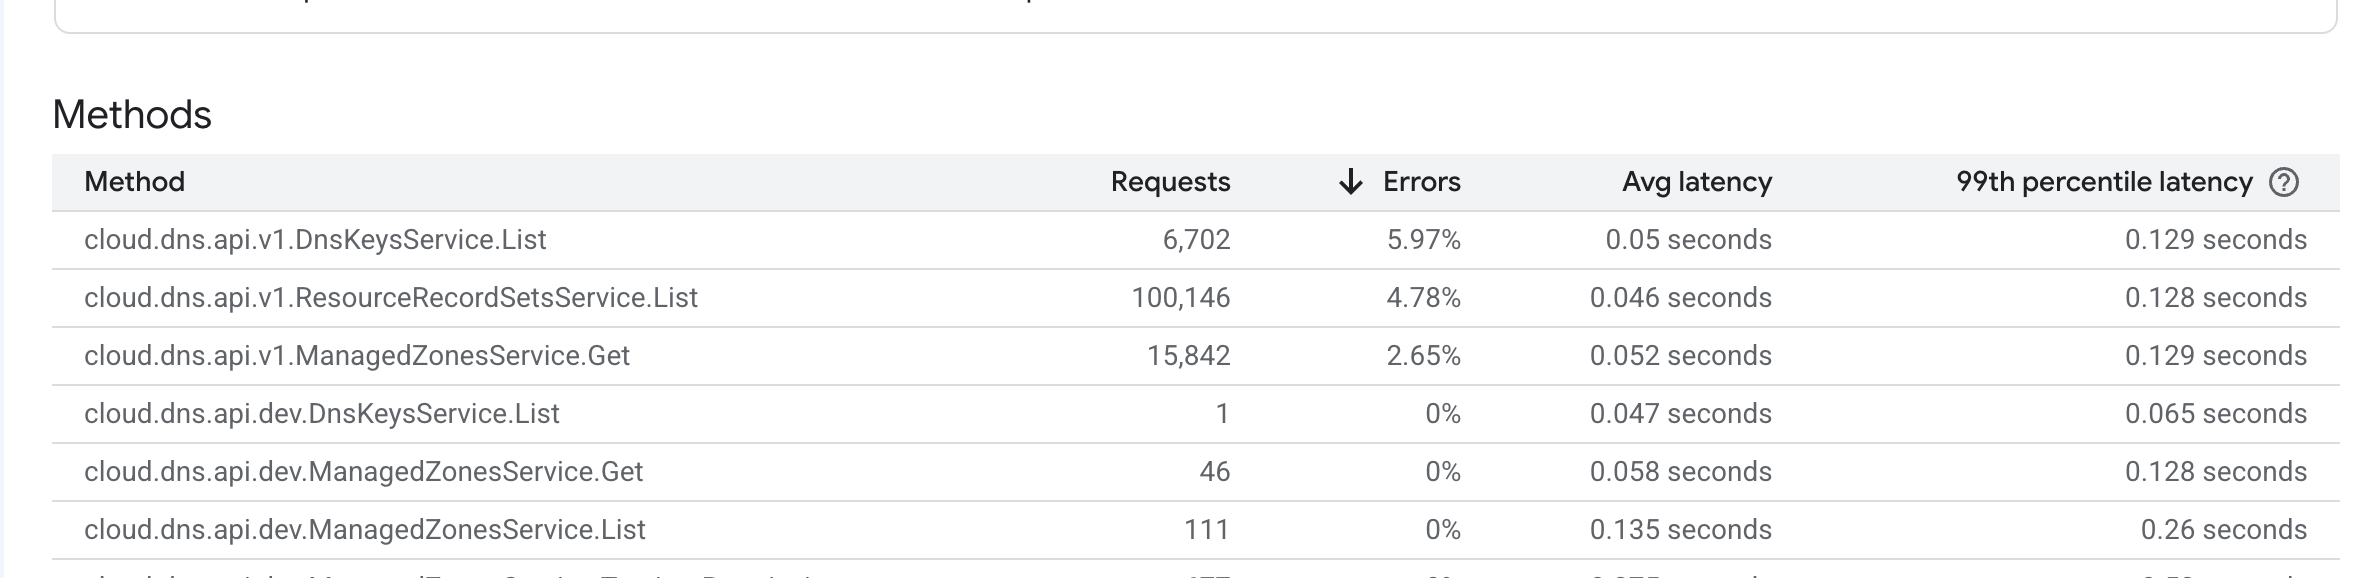
3. Check API usage and error rates to understand what's driving the consumption. The API dashboard shows request counts, error rates, and latency per method:
4. Increase the quota if the usage is legitimate. Some quotas can be increased through self-service.
Some quotas are marked is_fixed and require a support ticket
to increase. The VPC dynamic routes quota that caused the first
incident was one of these.
APIs to enable
Three APIs need to be enabled on each monitored project for quota metrics to flow correctly:
| API | Why |
|---|---|
cloudquotas.googleapis.com |
Accurate quota data. Not on by default. |
storage-component.googleapis.com |
Google Cloud Storage quota visibility |
storage.googleapis.com |
Google Cloud Storage quota visibility |
These get enabled through Terraform on all monitored projects once in the beginning, and were added to the new project Terraform module so future projects get them automatically.
Links and resources
- Cloud Monitoring: Using quota metrics ⧉ Google's documentation on quota alerting
- Metrics scopes overview ⧉ Multi-project monitoring (375 project default limit)
- PromQL metric name transformation ⧉ How GCP metric names map to PromQL names